Reverse engineering a IR thermometer LCD

I got one of these cheap IR thermometers (edit updated the link to something that works…)
http://www.aliexpress.com/item/1-Pcs-Laser-LCD-Digital-IR-Infrared-Thermometer-GM320-Temperature-Meter-Gun-Point-50-330-Degree/32374063240.html

Great tool for the money.

I thought it would be good to be able to control it and log to a PC for a couple of uses in the workshop.

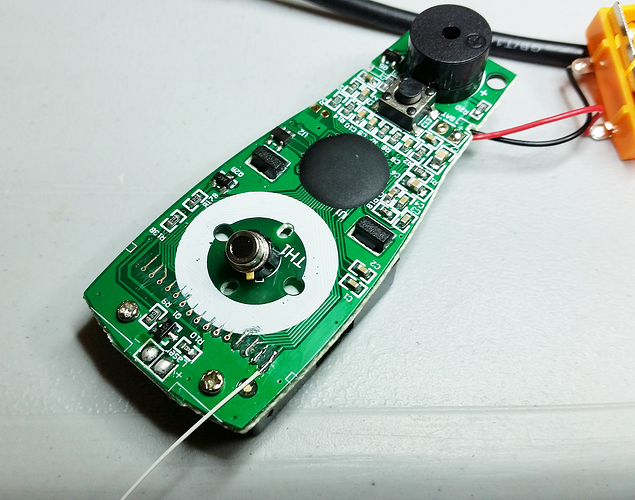
I did the obvious and pulled it apart to see if there was a serial bus I could tap. No such luck that I could find, with the controller under a epoxy blob. That didn’t leave many options other than reading off the LCD, either directly or via a webcam. I don’t find the webcam option all that practical for what I wanted.

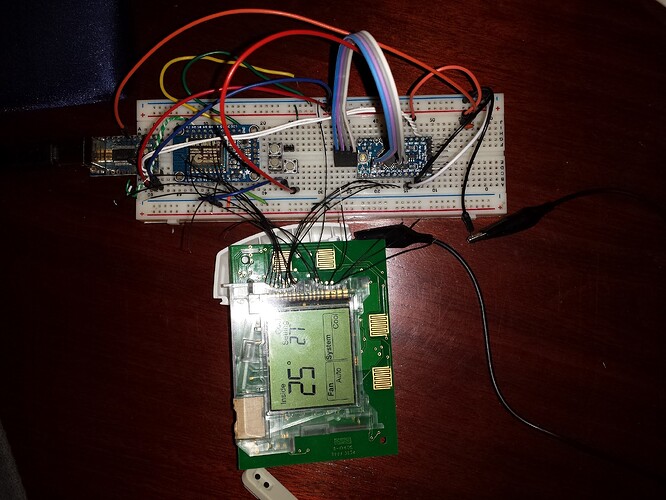
So I went about reverse engineering the LCD drive, and reading it off using an Arduino. The process goes along the lines of:

  • Disassemble and expose the LCD drive traces by scraping off the solder mask
  • Using a scope, find the common drive lines (LCD are driven using a matrix arrangement with common lines and segment drive lines)
  • Cut the traces to common drive lines, then use a function generator to excite each of the LCD common lines and all the segments lines to build a complete matrix for what combination drives what segments.

At that point, having captured the drive voltages and frequency combined with the drive matrix, you have everything needed to develop either a capture solution or a new LCD drive if re-purposing the LCD.

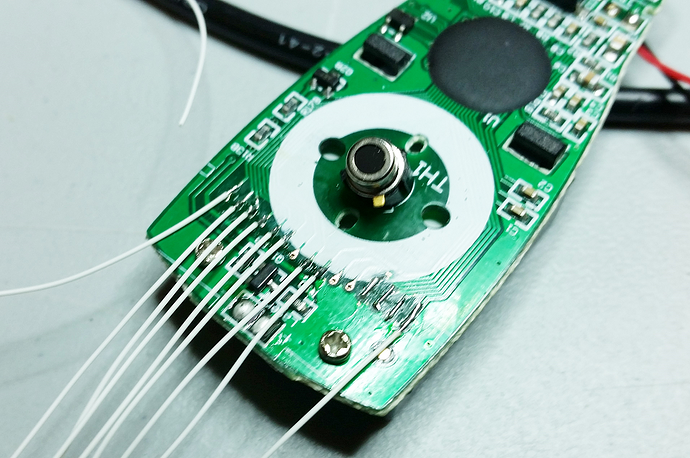
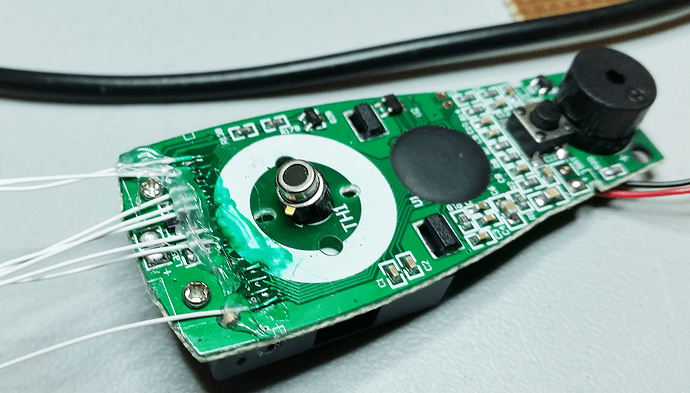
I then repaired the common drive traces, attached the wires to go to the Arduino (using wire-wrap wire), replaced the scrapped off solder mask with a UV cure paste and reassembled.

In this case the LCD drive scheme uses 4 voltage states, so to read the state required scanning the segment drive lines with the ADC. Fortunately I was able to get the info I wanted using only 8 of the segment drive lines, but ideally a controller with a wider ADC mux would have allowed more of the LCD functions to be monitored.

Below are some pictures of the process, but if anyone is interested in more detail I’m happy to answer questions or have a chat at the space on how to go about it.

Code will be put into GITHUB.

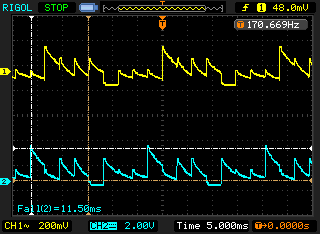
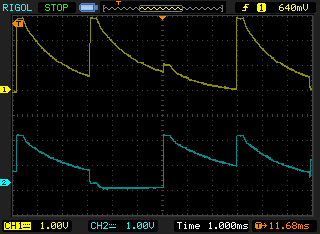
Scope capture of what the common drive signals (in this case the first two common lines is channels one and two.)

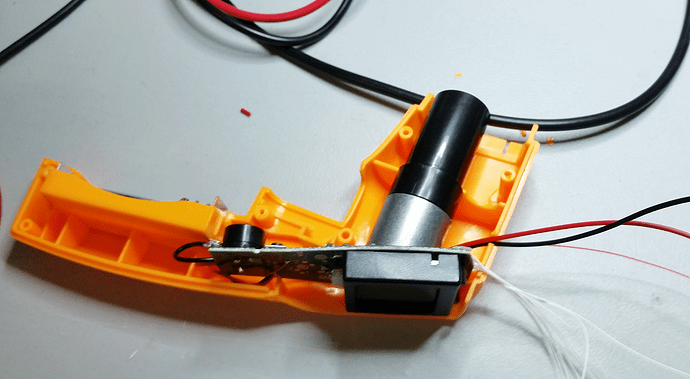
Disassembled, after the common lines on the right have been repaired.

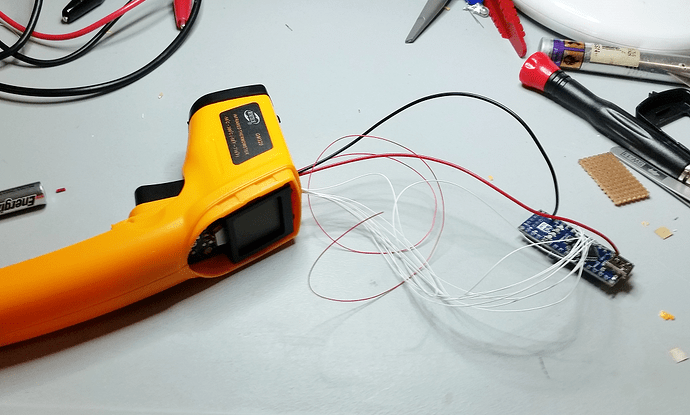
Connecting wires attached.

Solder mask repaired and wires hot glued down.

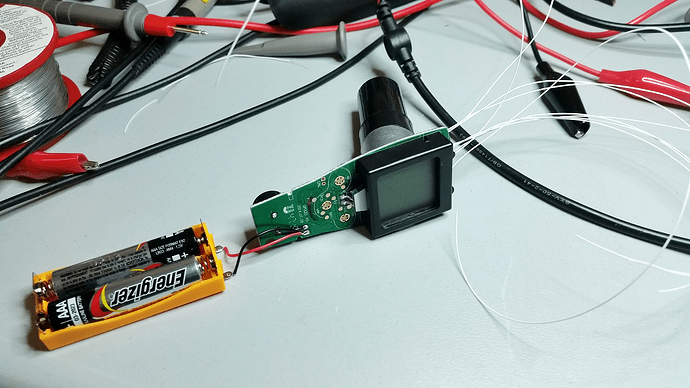
Lens assembly and display all reassembled prior to closing up.

How it fits in the case.

Almost reassembled.
1 Like

Code

That’s really cool. I have one of those and it’s such a fun ‘toy’. I know a few people with race cars and it would be a good way to monitor the temperature of a turbocharger.

1 Like

Below are my scribblings of the drive signals. Useful for anyone wiring up one of these IR thermometers specifically.

1 Like

Can you please explain a little more how you used the oscilloscope to find out the driving signals for a particular number.Thanks

There’s two parts to this, first is using the scope to find out whether the signals are “common” or “segment” lines. The second part is determining the mapping matrix of common vs segment lines to actual LCD segments.

The scope capture above is of two of the common lines. The key part here is they are always repeating with a single on cycle (i.e. drive to the full extent) per scan period and don’t change regardless of what’s on the LCD. You can also see in the scope capture that there are 4 common lines because there are 4 cycles to each scan period.

Once you know what role each of the wires play (either a segment drive or common line), then I cut all the common line traces and used a function generator to excite each combination of common line and segment line, then observed on the LCD which segment was active.

Whilst this does mean you need a function gen and scope, it’s actually a pretty quick process. I noticed this has been picked up by HaD, and was described as the “hard way”. Reality is, it’s not that hard at all if you do a bit of reading about how an LCD drive typically works.

1 Like

Can you explain further about the process, which models of equipment did you use, what settings used for the equipment, any extra hardware used to hook them up, etc.

I’ve had a number of queries offline for more details.

Currently I’m overseas on holiday so can’t do much, but I think the best way forward is on return I’ll pull the device apart again and do a youtube video of how to do all the investigations I did.

I think between my head and keyboard something is being lost in translation

Great, thank you! Can you also explain some as well on how you went about the coding for the Arduino and comment the code a lot more for newbies, I was finally able to figure out all the segments of my display with a 555 timer, flip flop and voltage divider. Still looking forward to your explanation though. When will you be back?

1 Like

Still got a couple of weeks away, so sorry wont be for a little while. Enjoying the highlands of Scotland at the moment :slight_smile:

Sounds like a great time, take lots of pictures!

I guess I will see what trouble I get into with this code.

Explaining the connections would be nice, maybe label them on the wire picture com0, com1, etc, Seg0, Seg1, etc and which pin you connected them to on the Arduino.

(Edit: I see now that there is the analog lines listed at the right of the matrix chart above. Didn’t know until I started playing around with the connections inside the code.)

Do you not connect the COM lines to the Arduino only the SEGment lines?

Edit: I also see now that it is only the SEGment lines.

Are you using the ProMini at 3.3v or 5v there?

Edit: When I attach the scope on the lines I do not get the nice uniform square clock signals did you have to do something special for that to work.


Would I have to change the code because my wave form doesnt look as clean as yours, said something about falling edge, where my falling edge is dying off, so would I need to use the rising edge?

With the code so far, I had to modify the matrix to my display a bit still trying to figure this code out commenting as I go along.

https://codebender.cc/sketch:327240

Brain Dump Google doc of the stuff I am trying to figure out.

I’m trying to read the most right hand 2 7Segment Values (Set Temperature), on the thermostat. (27) Degrees C

Thank you.

1 Like

Been trying to explain to myself in code comments what all the parts of the code do by looking it all up, I found the two comparator pins:

https://codebender.cc/sketch:327240

// Comparator Pins
pinMode(7,INPUT);
pinMode(6,INPUT);

The final image you posted above doesn’t look like anything but the display lines are hooked up,

Is there something that gets hooked up here to make it all work?

Why was this timer start exact value picked:

timer1_counter = 61453
// ((65535-61453)/2000000) = 0.002041 Seconds?

Lets start with some background. Fundamentally, the LCD works buy putting a voltage greater than the LCD threshold across each segment, which are multiplexed using the common lines. It’s done with an AC voltage so as not to permanently polarize the LCD segments. So to read what is on the display, we need to read the state of the segment lines when each of the common lines are active.

We could just find when each of the common lines become active and read all the segment lines at that time. In my case, I had an LCD driver that used a fairly complex 4 state voltage drive. Why they did this I don’t know, but because of it to check if a common line (or segment) is active requires checking if the voltage is in the higher or lower quarter of the voltage range. This means that a standard logic input would be unsuitable (unlike the case for many simpler LCD drives.)

My solution to this was to use the on chip comparator to detect the start of the common line 1 going high and trigger the interrupt. As we know the exact period of each of the common line cycles, by timing from the first common line we will know when common line 2, 3 and 4 will be high. By doing this we only have to trigger off one line, and can ignore the other 3 common lines (saving the need for another 3 comparators). So one side of the comparator is connected to a voltage divider to set the trigger voltage (which is in the top quarter) and the second part of the comparator is connected to the com 1 line.

Then I’m using the ADC to scan all the segment lines during each of the periods that the common lines will be active.

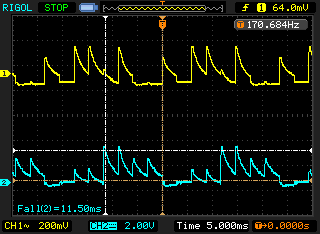
Now to those waveforms, that doesn’t look right at all. Are you grounding the scope probes correctly to the LCD driver ground?

I suspect there’s some issue in the measurement, a can’t image an LCD drive producing a sawtooth waveform like that. It looks like some sort of capacitive coupling of the probes between them.

  • Put both probes to DC coupling, you’ve got one on DC coupling and one AC coupled.
  • You’ve got one probe at 200mV/div and one on 2V/div yet the waveforms are about the same magnitude on screen, something is wrong here. Make sure your probe multipliers are set correctly both on the scope and on the probes themselves.

You’re going to need to get these measurements correct first before working on the code properly.

1 Like

The probe was grounded to the battery negative terminal of the thermostat, if I take it off it goes out of control. So I am assuming its grounded properly hopefully.

From what I read a lot of these static LCD’s uses different voltages, could this be why the wave is messed up?

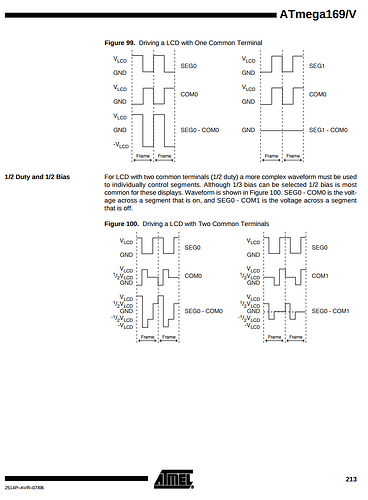
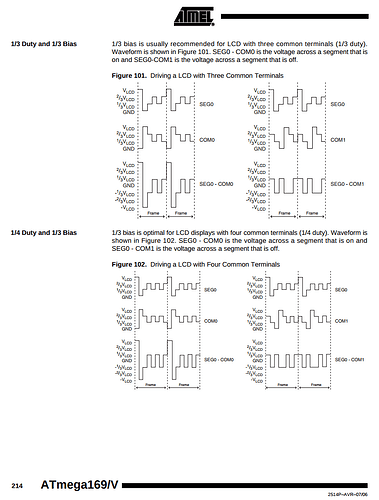
Check out page 213 - 214


See how the final wave form for 4 com terminals 1/4 Duty and 1/3 Bias example looks, they were not as crisp on the scope but it sorta does look like that.

Someone from IRC Electronics told me this atmega169v is a very common chip found driving Static LCD panels. So hopefully this will be a good thing to figure out.

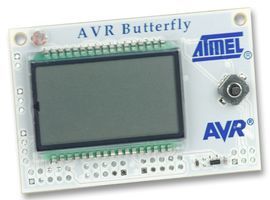
Also same chip in the AVR Butterfly Evaluation Kit

http://www.atmel.com/images/doc2514.pdf

What resistor values are you using for the voltage divider is this shown in any of your pictures?

I found someone talking about something similar:

"Compares voltage sensed at pins 6 (AIN0) and 7 (AIN1) which are the analog inputs into the comparator. AIN0 is
the positive input and AIN1 is the negative input to the comparator. Once the voltage on AIN0(+) rises above the voltage
sensed at AIN1(-), the comparator output becomes high and triggers the interrupt to run. The interrupt routine toggles
the LED connected to Pin 13. The ACO flag is tested in the loop() and Pin 9 is set to match. "

"The circuit:

  • Simple voltage divider made from two 10k resistors with the midpoint connected to AIN1(Pin 7 -)
    The end points of the resistors connect to +5V and ground
  • Varying input voltage that is normally below the set point of the divider. I used a CDS photocell above a 10k resistor
    configured as a voltage divider. The photocell connects to +5 and the 10k resistor, the other resistor leg connects to
    ground."

So from that example instead of the photocell you have the COM0 line going to AIN0(Pin 6+) and your voltage divider going to AIN1(Pin 7-) does this sound correct?

I upgraded the firmware on the scope tonight, to the latest and greatest, maybe there was a glitch in it. I will take another read tomorrow.

If we are reading an AC signal should it not be AC Coupling? I’m still new with this scope, I didn’t realize I had to set 2 separate settings to DC, to both channels when I took those screen grabs. I believe I just pressed the AUTO button at first to put the two channels on screen. I’m pretty sure I didn’t have the probes properly set in the scope software for the multipliers also as you said when taking the screenshot. My friend pointed it out to me after I took it. They were also saying the signal doesn’t look right, but he wasn’t familiar with my scope or what I was trying to accomplish and never dealt with static LCD’s before. I showed him your example but he didn’t seem to come to any conclusions after spinning the knobs and playing with the menus a bit.

Will take another scope screenshot today, with the settings you referenced, to see if it will help any.

Thank you for your further information on the process and hope Scotland is treating you well!

1 Like

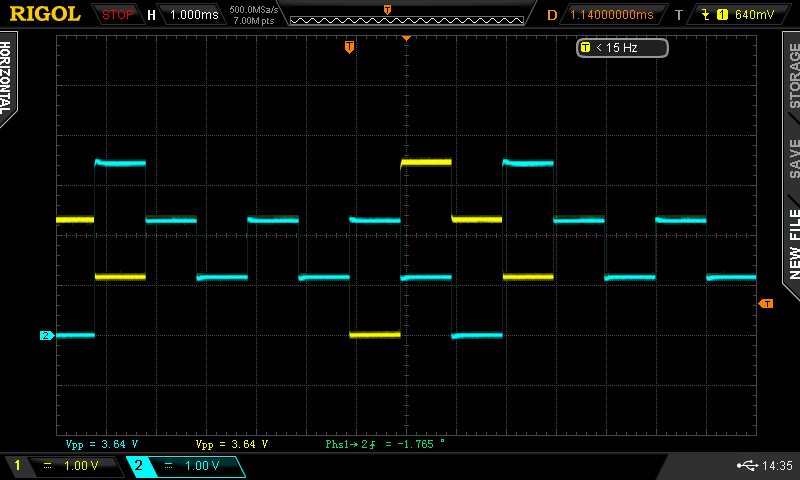
Set my settings to basically what was on your screen, I think…

Time 1.000ms

CH1 DC 1.00V
CH1 10X Probe (Physical Probe 10X)
CH1 attached to Seg0

CH2 DC 1.00V
CH2 10X Probe (Physical Probe 10X)
CH2 attached to Com3

I noticed if I put the probes to 1X it loads down the display and the segments go dim.

Didn’t seem to really change much from before.

1 Like

Did you make it back alive from vacation?

can you provide the circuit schema? because i am not sure where to conect the cables from thermometer to arduino.

i would also be very happy if you could post the connection schema from the thermometers pads to the arduinos analog pins, because otherwise (unless i missed something, in which case i’m sorry) it is pretty difficult to follow your results.

I also have one of these IR thermometers (Kitchencraft)

In my case the battery is draining quickly, checked a week ago and it was fine but draining to low battery warning.
Had the idea to install two of the sensors inside a VCR upper cylinder, as this approach though harder to interface is ideal for single axis applications.
Slow rotation of drum using existing driver coils so very low vibration.

1 Like