Monthly Financial Summary for Make Hack Void (2018-2019 Financial Year)

Hi all,
At the last committee meeting we discussed publishing a monthly financial summary of how MHV’s doing, and hopefully give a layer of transparency to the community regarding the Space’s finances.
I’ve made a summary of all info I’ve thought of so far that could be of public interest, if there’s anything else you might want to know in a following summary please let me know and I can revise it for the next summary, which should be published at the end of May/Start of June

But for now, here’s a summary for our standing as of the end of April/Start of May:

Summary for April 2019

Donations:


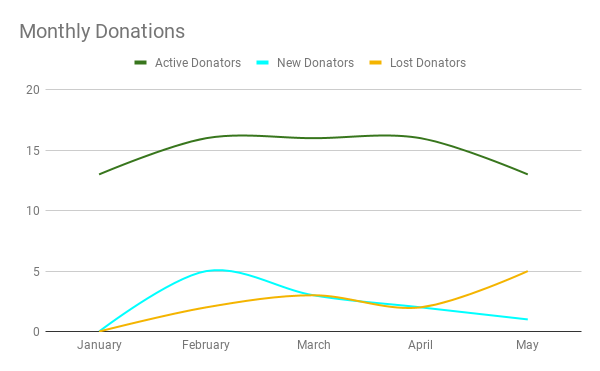
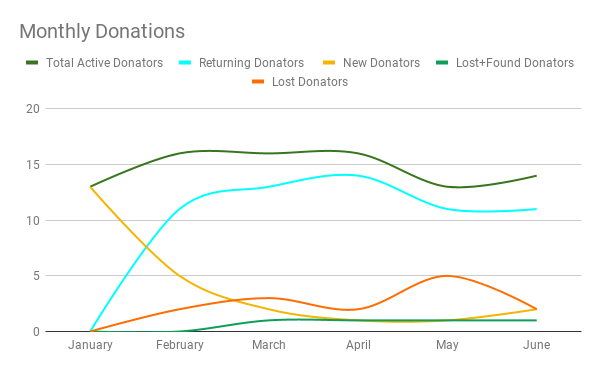
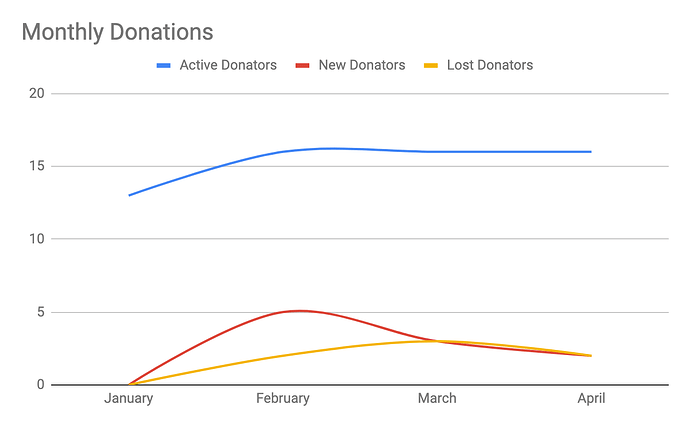
We have 16 active donators, including two new donators, and two lost donators.
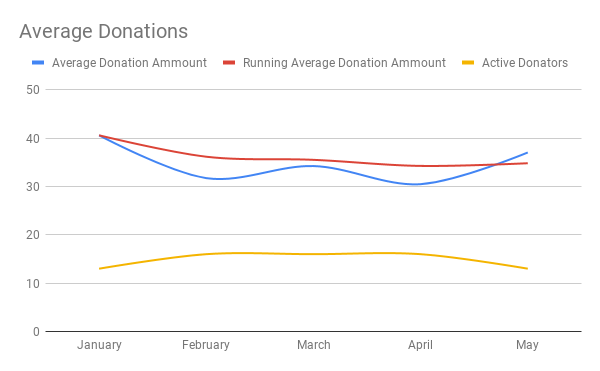
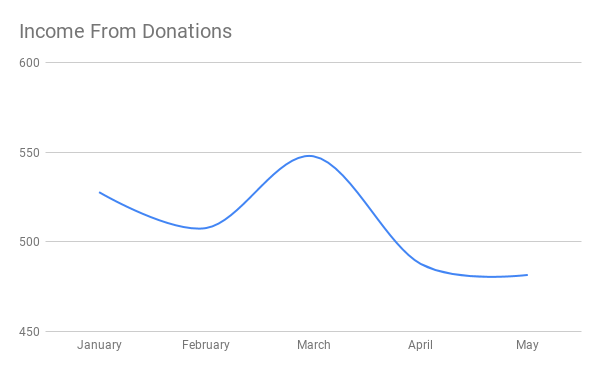
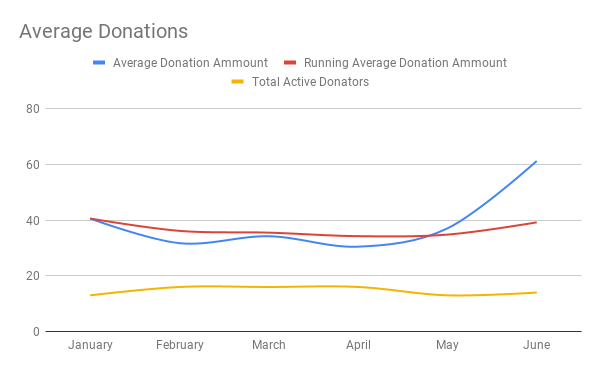
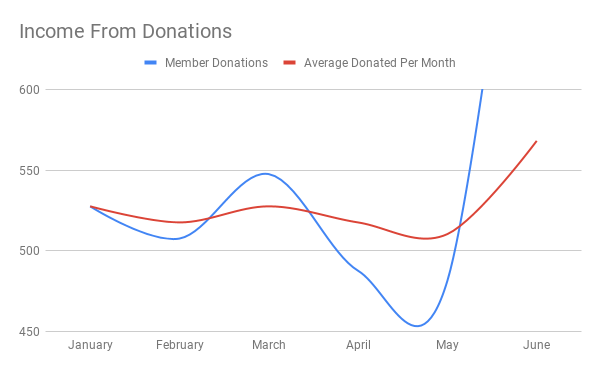
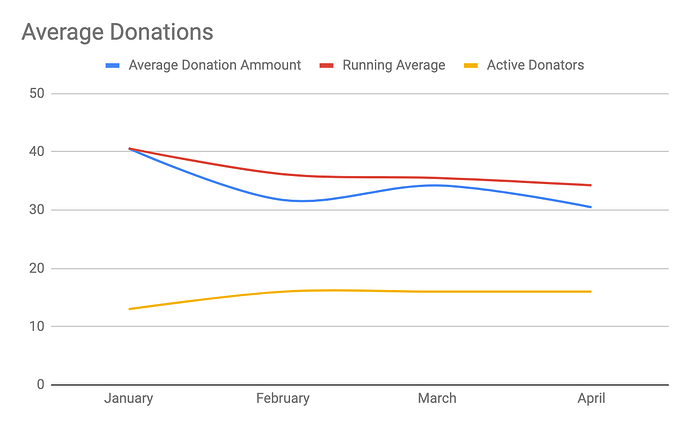
The average donation amount this month was $30.48125, down from last months $34.23125, and the yearly average of $34.25901442.
The peak average donation amount was January, with 13 donators averaging $40.59230769, and the overall peak total donated was March, with 16 donators averaging $ 34.23125

Income and Expenses
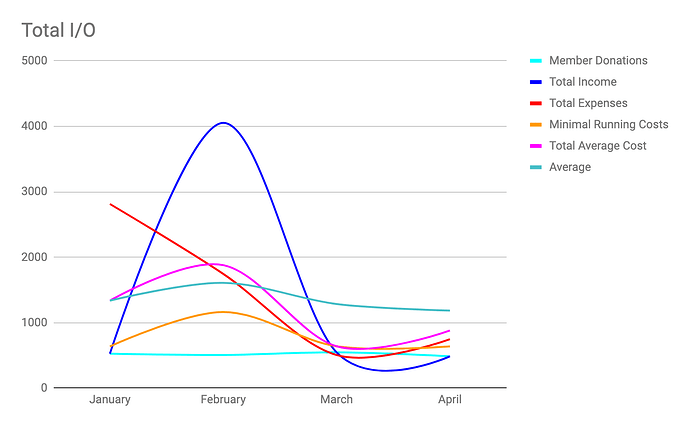
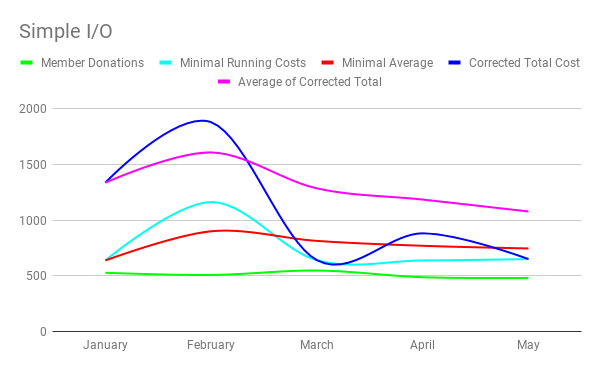
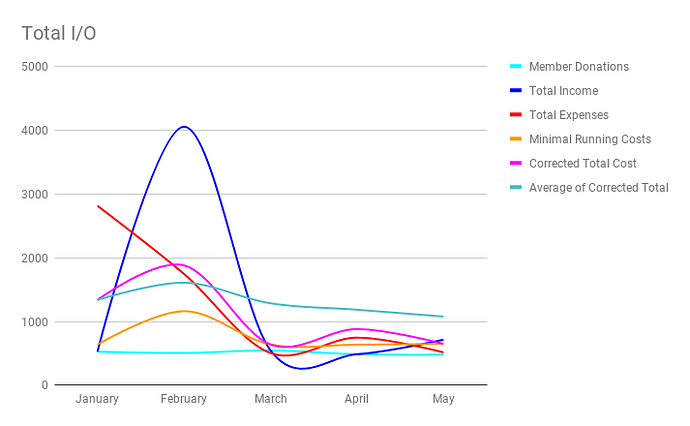
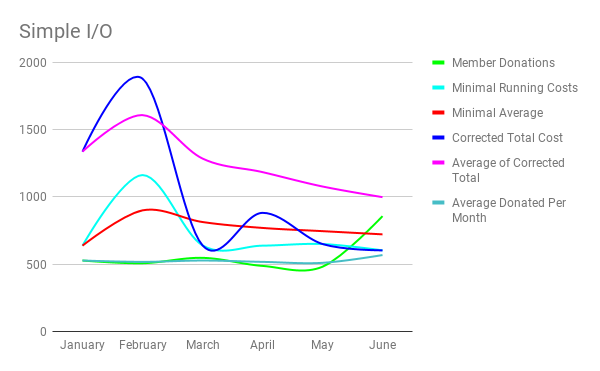
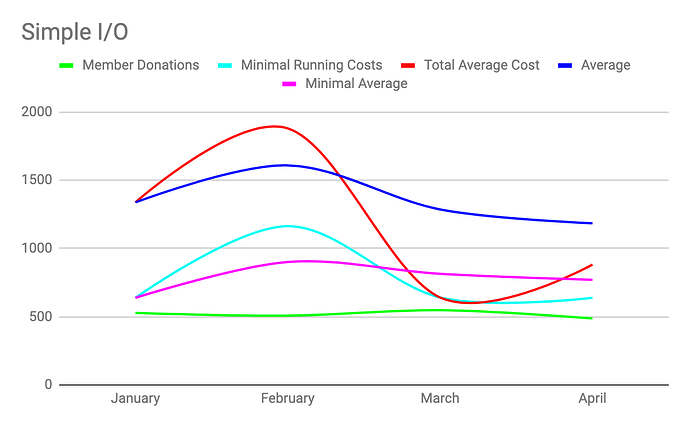
The following graph is most representative of the truth, as it treats monthly and yearly payments differently, by taking any yearly payments, dividing them by 12, and spreading them over the proceeding 12 months. Raw data will follow, but as far as keeping MHV afloat goes, this is the one that matters.


In this case, the green line needs to at least be above the pink line, as this is the average of our absolute minimal operating cost, including nothing other than rent and utilities (the light blue line).
The red line is our raw running cost, factoring and dividing yearly payments, and the dark blue line is the average of this.
The green line needs to get above the dark blue line for us to continue operating as-is.

Losses


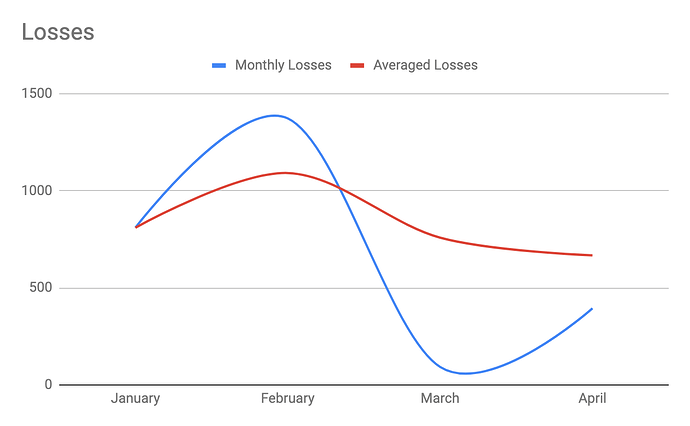
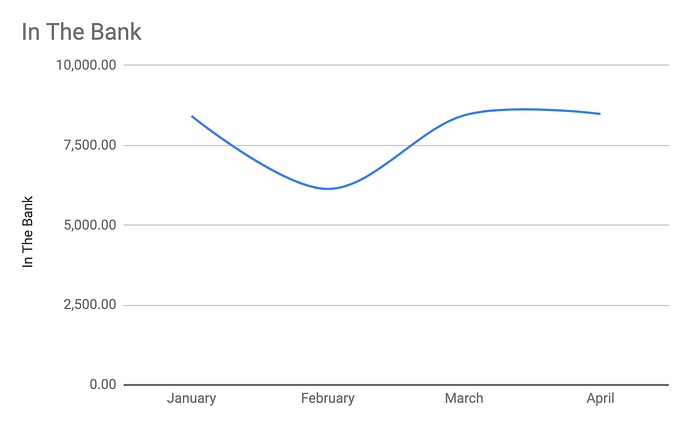
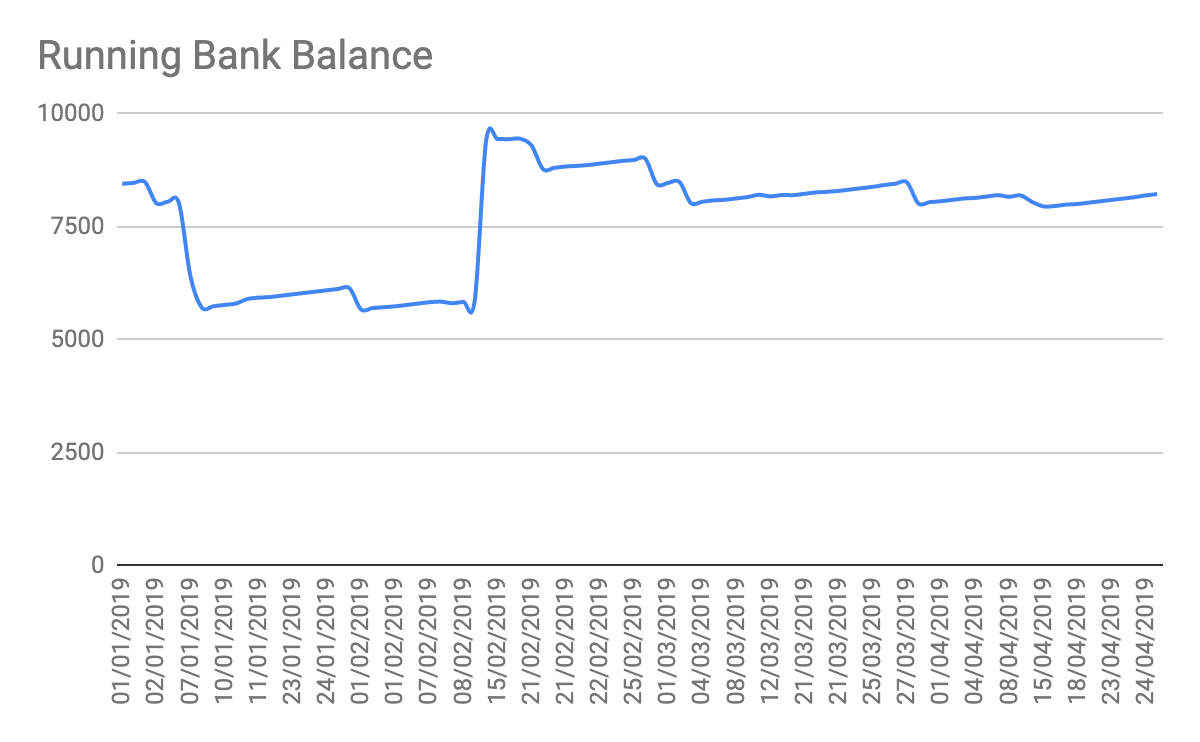
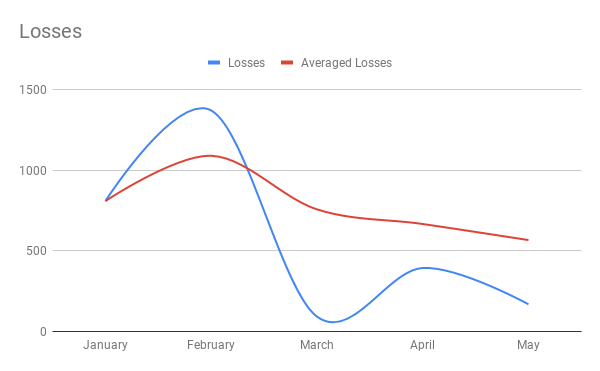
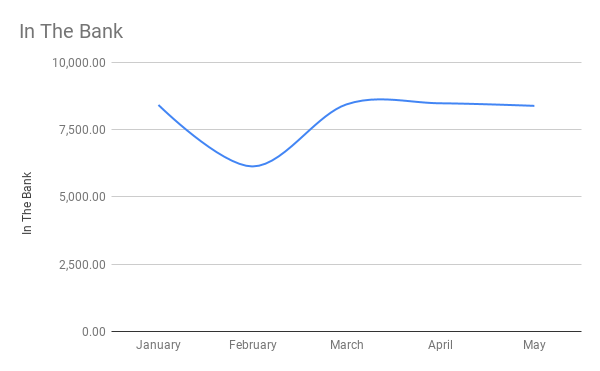
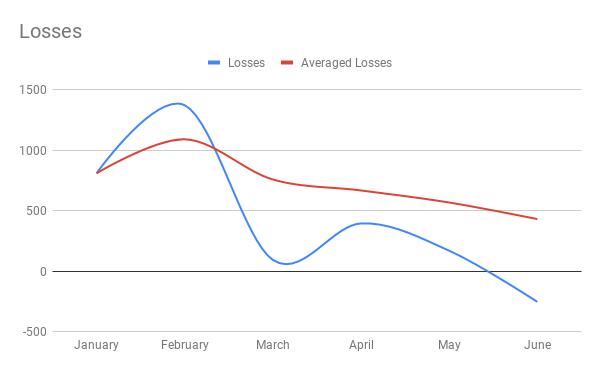
We are currently loosing on average $667.2125 a month, with $8483.14 in the bank, that gives us
12.7 months until our balance will be at zero. This does not factor for reserved money, but that’s a whole can of worms I’m not going into again (Sorry Ben, my bad).
So 12 months is our absolute maximum.
There is, however, a downward trend on losses, however we don’t yet have enough data to work out if it’s just statistical noise.
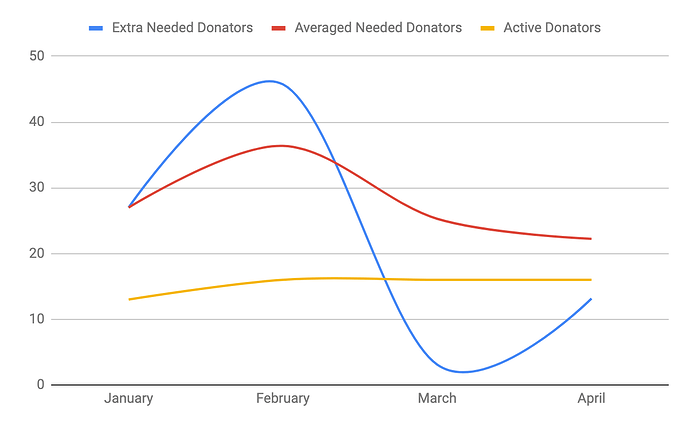
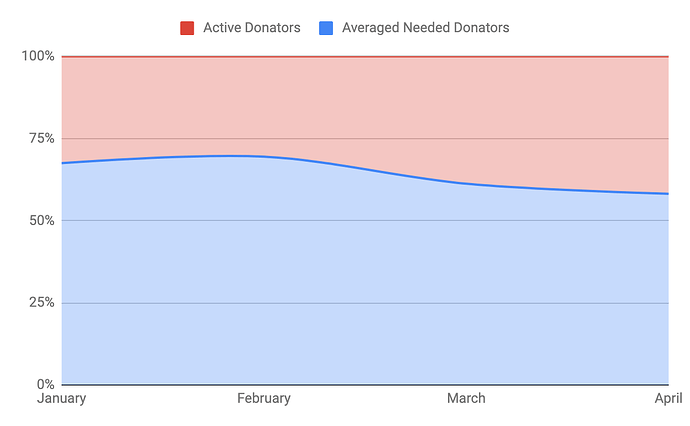
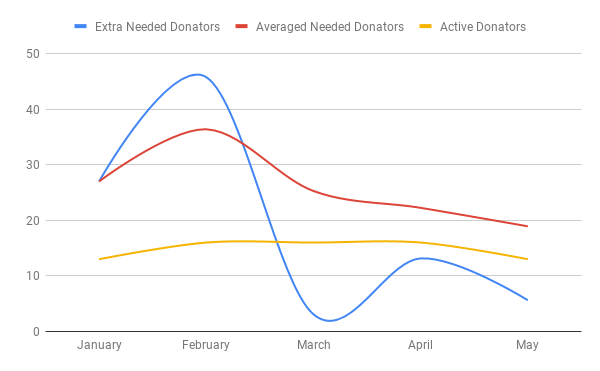
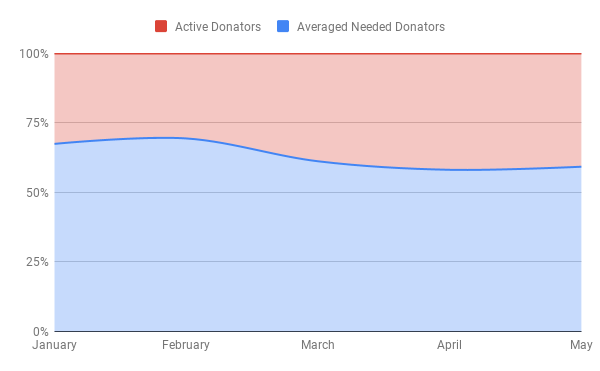
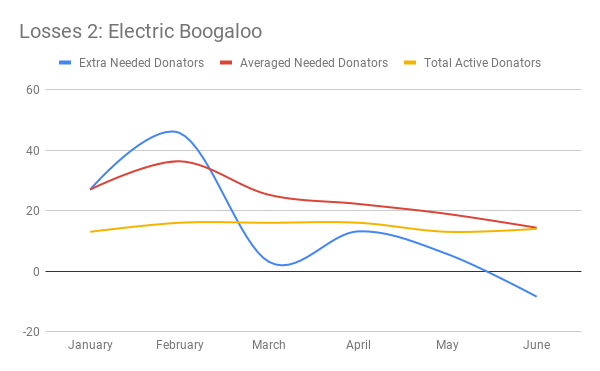
This all said, we’ve got less than half as many people donating as we need.

RAW INFO
Here’s just some other graphs for you to make use of yourself.
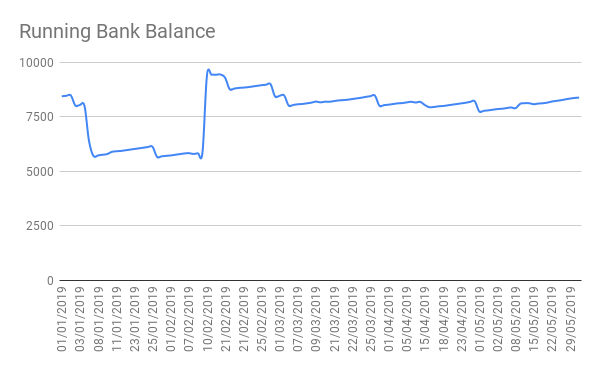
(Keep in mind, this includes things like the ~$3.5k glowforge refund, $1.5k one-off insurance payments, and a whole bunch of other stuff, totally unfiltered.
tl;dr We’ve got around 12 months maximum to double our number of contributing members.

A super good analysis …lets hope this helps turn the tide…

It has come to my attention that we may be being overcharged for some services, so I’ll hold off on the monthly summary for the time being until I have been able to investigate further.

1 Like

Alright, there’s no time as good as bed time for doing spreadsheets, because, if you’re lucky, you’ll fall asleep on your keyboard half way through.
No such luck here, so it’s time for

MHV Financial Summary for May 2019

Donations:
Monthly%20Donations
Average%20Donations
We have 13 active donators, including one new donator, and five lost donators.
(Discrepancies with last months numbers are due to me not considering a donator who missed one month a “New” donator, even though the previous month they were considered a lost donator. For future months, I will add an additional category of “Returned” donators.)

The average donation amount this month was $37.04, up from last months $30.48 despite having three less donators, and the yearly average is $34.82.
The peak average donation amount remains as January, with 13 donators averaging $40.59, and the overall peak total donated remains March, with 16 donators averaging $34.23.
Income%20From%20Donations
Income and Expenses
The following graph is most representative of the truth, as it treats monthly and yearly payments differently, by taking any yearly payments, dividing them by 12, and spreading them over the proceeding 12 months. Raw data will follow, but as far as keeping MHV afloat goes, this is the one that matters.
Simple%20I_O
In this case, the green line needs to at least be above the red line, as this is the average of our absolute minimal operating cost, including nothing other than rent, utilities, and divided yearly payments (the light blue line).
The dark blue line is our raw running cost, factoring and dividing yearly payments, and the pink line is the average of this.
The green line needs to get above the pink line for us to continue operating as-is.

Disclaimer
I will note here, however, that I have noticed some anomalies with what we have been charged for services rendered or, in some cases, not rendered, dating back as far as September 2016.
If this is the case, then, once corrections have been made, this could reduce both our minimal running cost and corrected total cost by a not insubstantial amount, alongside what I suspect will be a significant reimbursement, and I will provide further details when I am at liberty to divulge further.
In this months calculations, I have corrected for spurious transactions, and, should the issue be resolved, for next months summary I will recalculate all months to date to provide more accurate graphs going forwards.
For now, treat all information as provided with a pinch of salt.

Losses
Losses
Losses%20Delta
Needed%20Delta
We are currently loosing on average $567.532 a month, with $8387.7 in the bank, that gives us
14.8 months until our balance will be at zero. This does not factor for reserved money, however I will propose to set a safe shutdown threshold at the next committee meeting, which has been moved forwards to the Second of July, 2019.
While it is good that our time-to-live has increased from 12.7 months to 14.8, (retroactively) factor in a safe shutdown threshold of $2,000 and it’s gone from 9.7 months to 11.3 months, a good thing regardless.
We remain as having a maximum of 12 months to live, however, we didn’t know that last month we only had 10 months, so it’s gone up anyway.
I will remind you that, due to various issues yet to be resolved, our running costs may be somewhat lower that currently thought, so, hopefully, by next month, our TTL will be significantly longer.

Our downward trend on losses remains steady, however we don’t yet have enough data to work out if it’s just statistical noise for sure.
We remain as having less than half as many donators as needed.

RAW INFO
Here’s just some other graphs for you to make use of yourself.
(Keep in mind, this includes things like the ~$3.5k glowforge refund, $1.5k one-off insurance payments, and a whole bunch of other stuff, totally unfiltered, along with anomalous transactions yet to be dealt with.
In%20The%20Bank
Running%20Bank%20Balance

Note for next months Summary:
Refactor for any corrected months transactions
Include “Returned Donators” as a category
Create additional spreadsheet charting time-to-live
Add “Total needed Donations” onto graphs, as just having the current amount and extra needed doesn’t show a clear delta

1 Like

This is gonna hurt, but I’ll be re-doing the financial summary from scratch at this point, going back to the start of July 2018. (I’ll leave donations as-is, as a running total from January, because why bother, but as for everything else, I’ll start from scratch, now that I’ve got a clearer picture of what’s been going on the last year or so due to the financial audit which I’m totally not trying to avoid doing by writing the financial summary (gotta have something to present tonight)).

Alright, round three of
Ryan’s Happy Funtime Financial Summary for Make Hack Void! July 2019
This is gonna be the last one for the 2018-2019 financial year, so I’ll throw just a LITTLE bit extra in!
(Also, because there are things I’ve only really just worked out now, so hopefully for the 2019-2020 financial year, all the summaries will be in the same clear, concise format!
Good, the HTML sarcasm tag works here.

Might as well start big
Now it’s over: How did the year go?
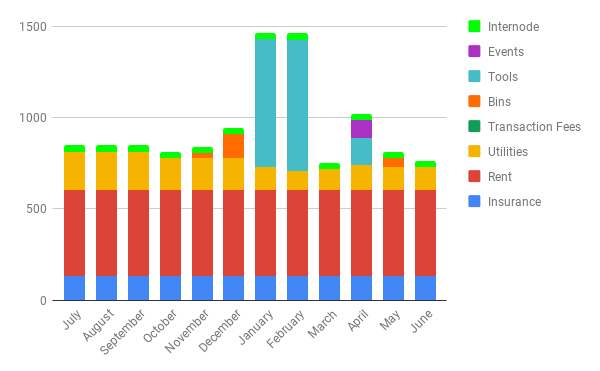
Expenses for the year:
Year%20In%20Review
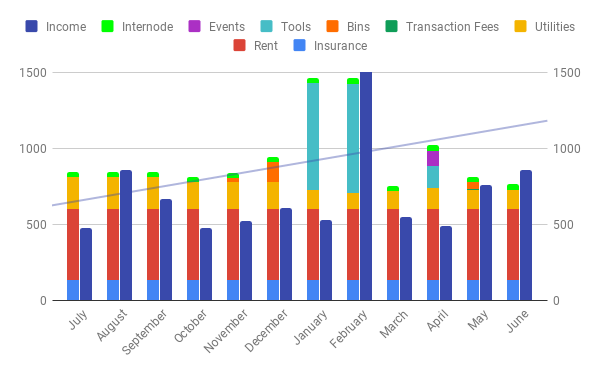
Now with income:
With%20Income
(Notice the trend line is thrown off by one large event, the refund we received for the glowforge)
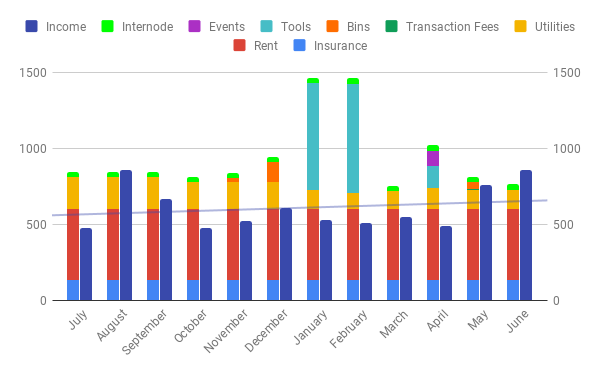
Let’s get rid of that single transaction and see what happens:
Without%20Refund
Much better.
You’ll notice that in only three out of 12 months did we have enough income to pay Rent, Utilities, and Insurance.
6 out of 12 months we didn’t have enough to pay for Insurance and Rent alone (It’d be 7/12 if not for $4.44 in December).
9 out of 12 months we didn’t have enough to pay for Insurance, Rent, and Utilities.
2 out of 12 months we had enough to pay for everything.
Our average monthly income of $899.99 would almost keep us floating, but take away the glowforge and it drops to $604.64.
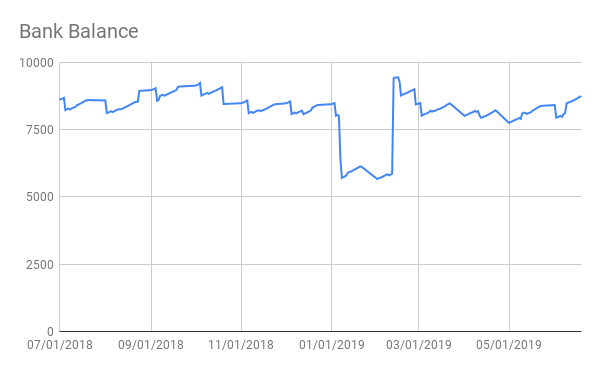
Speaking of, here’s our bank balance for the last 12 months:
Bank%20Balance
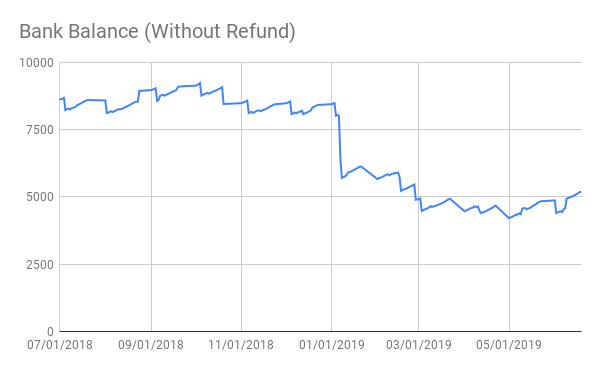
Now, let’s take out that massive boost from the refund:
Bank%20Balance%20(Without%20Refund)
No recovery after the January from from paying insurance.
Expect another drop like that in 6 months.
In other words:

Anyway, onto the monthlies:
Summary for July 2019

Donations:
Monthly%20Donations
Average%20Donations
Income%20From%20Donations
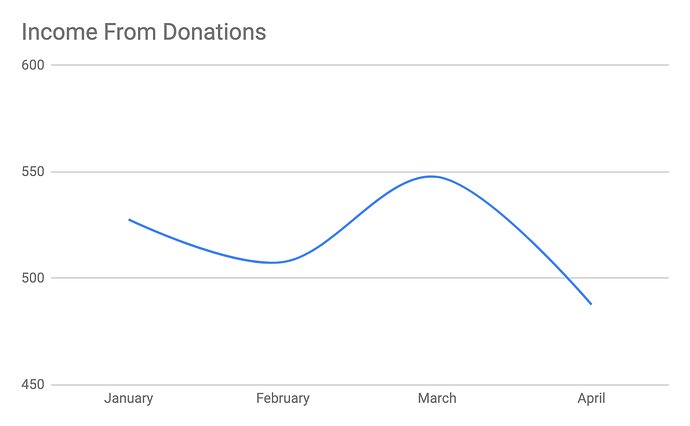
We’re slightly up on donations this month, but I believe this is due to someone making a once-off/yearly donation. Averages are important. Look at them averages

Income and Expenses
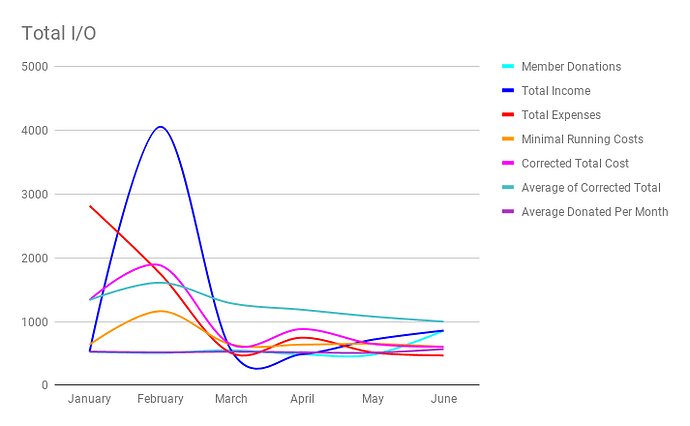
The following graph is most representative of the truth, as it treats monthly and yearly payments differently, by taking any yearly payments, dividing them by 12, and spreading them over the proceeding 12 months. Raw data will follow, but as far as keeping MHV afloat goes, this is the one that matters.
(Additionally, I have included an average of our donations as well, because, for the first time since January, we’ve had a higher income than we’ve spent! Yay! Still, that’s just from a one-off donation, our average is still below par)
Simple%20I_O
Teal line needs to be above Pink to stay afloat.
Light green being able dark blue and Red means we got more in this month than we spent, and are spending (minimally on average, just Insurance+Rent+Utils), but still not above our overall average (pink).
All in all I think this graph is deprecated by the first three I posted, but I’ve included it here for legacy purposes.

Losses
Losses
Losses%202%20Electric%20Boogaloo
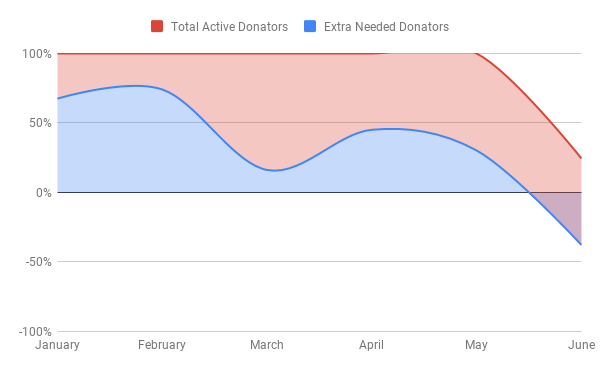
(Remember, this graph isn’t stacked, meaning we need as many new donators as we currently have)
Here’s a graph that shows this a little clearer:
Divide%20By%20Zero
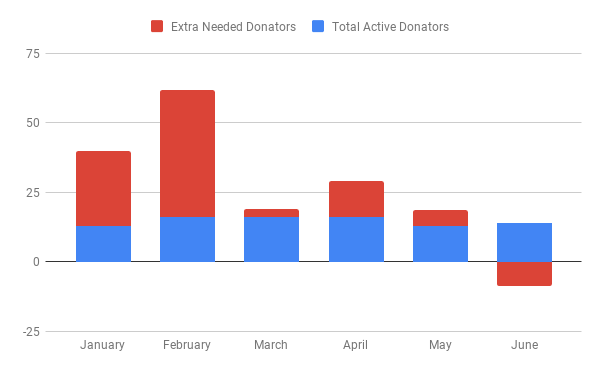
…guess I didn’t factor for us ever having surplus when I wrote those formulas, time for an update…

IT'S%20NEW
NEW AND IMPROVED!
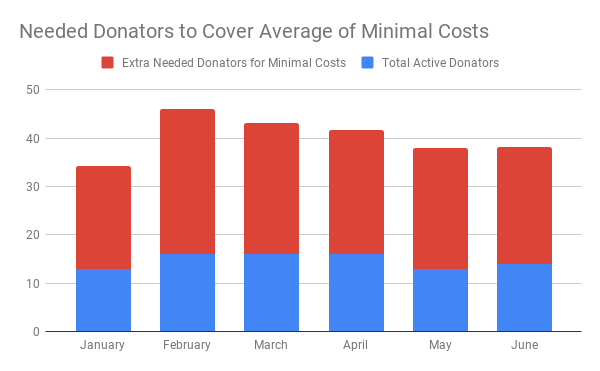
But I’m not happy with it because it doesn’t properly convey our dire situation, and may falsely give you a sense of hope. Let’s fix that:
Needed%20Donators%20to%20Cover%20Average%20of%20Minimal%20Costs
Stacked graphs. That’s better.
And this is minimal costs, by the way. Just to cover Insurance+Rent+Utils, nothing more.
So we’re not quite half way there yet.

Finally, Raw info:

Disclaimer:
In the last month I found out that, since September 2016, when we moved out of Belconnen, we have continued paying for an internet connection to the address at our previous address. I was unable to find any communications with the service provider indicating our intent to cancel the connection.
While it has been subsequently cancelled, I was unable to obtain a refund for the services paid for.
If you, or someone you know, has any evidence whatsoever that someone, at any point, tried to cancel OR MODIFY the service to that address, please, let me know.
Additionally, I am in the process of investigating what I believe to be abnormally high electricity usage at the space.
If you’ve stuck a bunch of resistors into a powerpoint somewhere, please, let me know.
(We’re averaging around 16KWh a day, I believe)
Is someone charging their Tesla here?
That’s all for now, lemme know if there’s any more info you want in the following summaries.

1 Like

I have found the air conditioner heating left on from the wednesday night, or tuesday night, once or twice before.
Also the light in the entrance way is frequently not turned off.
Is there any possibility of silliness like MHV is being being hit with the bill for the oval lights or something??

I’ve asked about the oval lights specifically, and they’re getting a bill orders of magnitudes higher than ours.
If the entry light was 800-1000 watts, and on constantly, then it’d make up for the power usage we’re seeing, but alas, it’s probably a tenth that.
The interesting thing is our power usage is near constant at 16kw/h all year round, so this isn’t something intermittent like, perhaps, the aircon being left on now and then. Something, somewhere, is drawing 16kw/h a day, on average, all year round. I’d very much like to find out what it is (and if I can’t work that out, then start asking questions about our usage being guesstimated).
From now on, cold drinks aside, I think it may be best to simply turn off all power to the space at the breakers for a month or so and see if it has any significant impact on our power usage.
It’d be so much easier if I could just access the damn meeter, but apparently it’s under lock and key in the adjacent building.
Perhaps if people are playing sportsball one night I’ll try and sneak in, see what’s up. If not I’m calling property group and getting an escort into there for as long as it takes for me to work out exactly what’s using all our power.

1 Like

Try turning of the hot water, I reckon that is about the only thing that is constantly drawing power.

Hot water’s off.
On thing I did notice yesterday was the UPS for our router/server, now unused, was radiating quite a lot of heat.
I’m not sure if it’s possible that, with dead batteries, it could be charging indefinitely, but a constant draw of around 400 watts is what our bills are showing. Could be this.
I’ve cut the breakers to all non-essentials after leaving the space, if we do this for a month or so that should tell us accurately what’s going on (the fact that our bills only change slightly throughout the year, and having the hot water heater disabled seemed to make no difference suggests that people are guesstimating. This would also explain the energy increase over summer, “consistent with that of a three person household”).

The clock is now powered by the door circuit so it won’t stay on all the time. I don’t expect the 15 or so LEDs active at any one timew would draw that much power - but every bit helps.

3 Likes

Thanks, the clock was always a bit of a curiosity, I was surprised when it never went out with the door circuit until I realised it was powered separately.
We mightn’t know exactly what is drawing power, but it’s good to know what isn’t.